Crude Oil Prices May Rise as Gold Falls, Both Approach Key Levels
CRUDE OIL & GOLD TALKING POINTS:
- Crude prices rose as the US pushed allies to cut Iran oil imports to zero
- Gold may fall as trade war worries boost the US Dollar on haven bids
- The commodity and yellow metal are near key levels on the daily chart
Crude oil prices rose to their highest since May 24th on Tuesday despite plans from Saudi Arabia to increase output to a record 10.8 million barrels per day. This followed a response from over the weekend where Saudi Energy Minister Khalid Al-Falih said that the total OPEC+ oil hike will be closer to 1m b/d rather than +600k. The latter estimate was the derived real value from last week’s gathering of the commodity producing cartel.
Rather, oil prices were more interested in developments out of the US. First, the US was reported pushing its allies to cut Iran oil imports to zero by November 4th. More potential supply disruption threats sent the commodity rallying. If that was not enough, API estimates pointed to a larger-than-expected contraction in US crude stockpiles of 9.23m barrels last week.
Meanwhile, gold prices declined on Tuesday largely thanks to a rise in the US Dollar on safe haven bids. The precious metal is known for its anti-fiat properties given that it has no associated yield, thus it often moves inversely to the greenback. The US Dollar also managed to brush off worse-than-expected local consumer confidence data.
Ahead, crude oil will eye the EIA weekly inventory report. There, stockpiles are anticipated to contract by 3 million barrels last week. A higher-than-expected reduction in supply (as mentioned earlier) may further add momentum to oil’s ascent.
Gold prices on the other hand face US trade data and durable goods orders, a beat there may boost the greenback and thus inversely impact the yellow metal. But the focus will arguably be on trade war fears which stands to bolster the US Dollar in a similar way that we saw on Tuesday.
BACKGROUND: A Brief History of Trade Wars, 1900-Present
GOLD TECHNICAL ANALYSIS
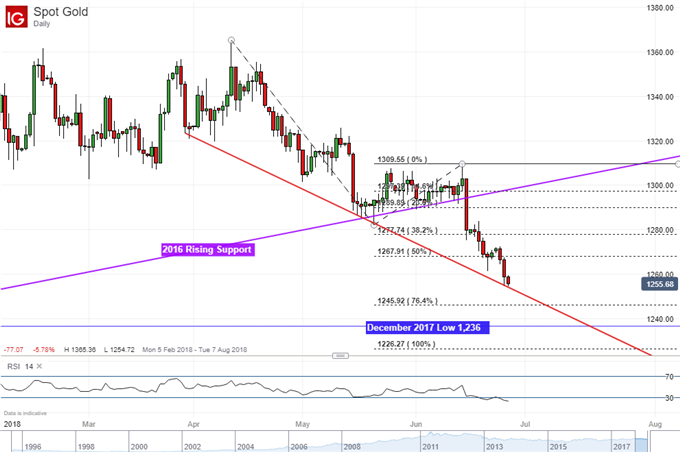
Gold prices have been in a downtrend since April and a near-term falling support line seems to be doing a good job at controlling the descent. It may not be much longer now until the yellow metal finds itself testing the December 2017 low at 1,236. This might be the case given the break below a long-term rising trend line from 2016. Still, immediate resistance is at 1,267 followed by 1,277 as indicated on the Fibs below.
CRUDE OIL TECHNICAL ANALYSIS
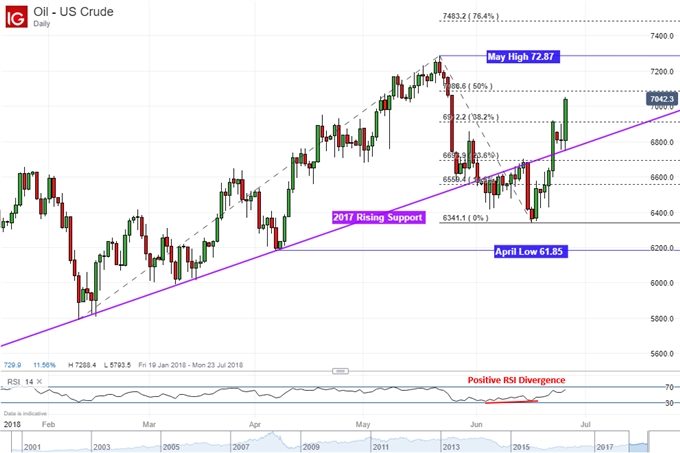
After a false breakout below the 2017 rising support line, crude oil prices are once again on the rise as they approach the May high at 72.87. From here, it must pass near-term resistance at 70.88 which is the 50% Fibonacci extension before testing that. Immediate support appears to be that trend line again and a break below it leaves the 23.6% level as the next target at 66.93.
Start Trading with Free $30 : CLAIM NOW $30

VERIFY YOUR ACCOUNT AND GET YOUR $30 INSTANTLY ,MAKE MONEY WITHDRAW !!
IF YOU FACE ANY PROBLEM TO GET THIS OFFER PLEASE CONTACT US FOR
SUPPORT , CLICK SMS BAR ABOVE THEN TALK TO US.


Comments
Post a Comment