Crude Oil and Gold Prices May Retreat on Upbeat US Jobs, ISM Data

CRUDE OIL & GOLD TALKING POINTS:
- Crude oil prices retreat as EIA data puts November output at record high
- Gold prices digest gains following sharp surge after FOMC rate decision
- Upbeat US payrolls, manufacturing ISM data may hurt commodity prices
Crude oil prices fell after touching a two-month high – erasing the intraday rally to finish the session with a fractional decline – after EIA data showed that US output hit a record high at 11.9 million barrels per day in November. Weekly figures hinted at an average of 11.7 million b/d over the same period, although they have since pushed up to 11.9 million b/d in January. Gold prices digested yesterday’s Fed-inspired surge.
US PAYROLLS, ISM DATA MAY WEIGH ON COMMODITY PRICES
Looking ahead, January’s US labor-market data and the manufacturing ISM survey are in focus. The former is expected to show a slowdown in payrolls growth while the latter points to a slight pick-up in the pace of factory sector activity growth. US releases have increasingly improved relative to forecasts in recent weeks, hinting that analysts have become too pessimistic and opening the door for upside surprises.
One might have expected that crude oil prices will rise alongside stocks and other cycle-oriented assets as global slowdown fears abate if incoming news-flow follows this trajectory. That need not be the case. Markets cheered as a visibly spooked Federal Reserve talked down rate hike prospects earlier this week. Data releases allaying policymakers’ worries might turn this dynamic on its head, triggering risk aversion.
The response from gold prices may be more straight-forward. A risk-on response to upbeat releases is likely to translate into higher Treasury bond yields, sapping the appeal of non-interest-bearing assets. Alternatively, a Fed-centric narrative whereby an upshift in policy bets cools risk appetite may still nudge borrowing costs upward, producing the same result on net for the yellow metal.
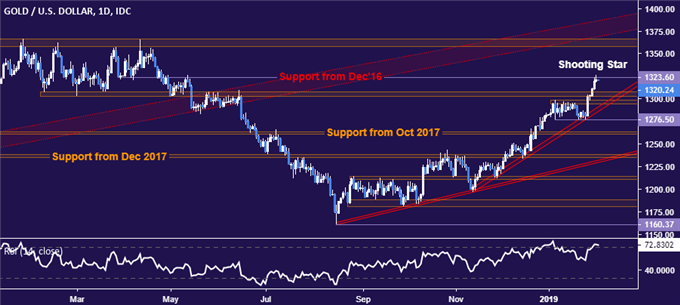
GOLD TECHNICAL ANALYSIS
Gold prices put in a Shooting Star candlestick pattern on a test of chart inflection point resistance at 1323.60, speaking to indecision and warning that a turn lower may be ahead. Sellers face a dense support area capped by a rising trend line at 1286.69. A break below that exposes 1276.50. Alternatively, a daily close above 1323.60 targets trend-defining resistance in the 1357.50-66.06 area.
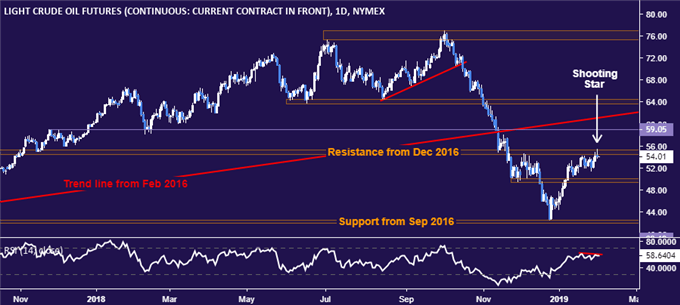
CRUDE OIL TECHNICAL ANALYSIS
Crude oil prices have also produced a Shooting Star, with negative RSI divergence bolstering the case for a forthcoming downturn. Support starts in the 49.41-50.15 area, with a daily close below that setting the stage for a retest of the 42.05-55 region. Alternatively, a push above resistance in the 54.51-55.24 zone opens the door for a test of the chart inflection point at 59.05.
BEST XM OFFER OF FREE $30 TRADING BALANCE PROFIT WITHDRAWAL
LOW SPREAD AS 0.0 PIPS


Comments
Post a Comment