GBP/USD Rate Threatens Bull Trend Ahead of Brexit Deadline

BRITISH POUND RATE TALKING POINTS
The British Pound remains battered after days of strenuous negotiations as Prime Minister Theresa May fails to secure a Brexit deal, and the GBP/USD exchange rate may exhibit a more bearish behavior over the coming days as both price and the Relative Strength Index (RSI) threaten the upwards trends from late last year.
Fundamental Forecast for British Pound: Bearish
The Brexit saga continues as the third defeat for Prime Minister May forces Parliament to lodge alternative options ahead of the April 12 deadline, with the region facing a growing risk of leaving the European Union (EU) without a deal as U.K. lawmakers struggle to meet on common ground.
The British Pound is like to face a bearish fate from a no-deal Brexit as the Bank of England (BoE) warns that ‘the economic outlook will continue to depend significantly on the nature and timing of EU withdrawal,’ but it remains to be seen if an extension will be requested as European Council President Donald Tusk plans to hold an emergency meeting on April 10. With that said, headlines surrounding Brexit may continue to influence the British Pound as the economic docket for the U.K. remains fairly light throughout the first full-week of April, but the recent pickup in British Pound volatility appears to be shaking up market participation amid a shift in retail interest.
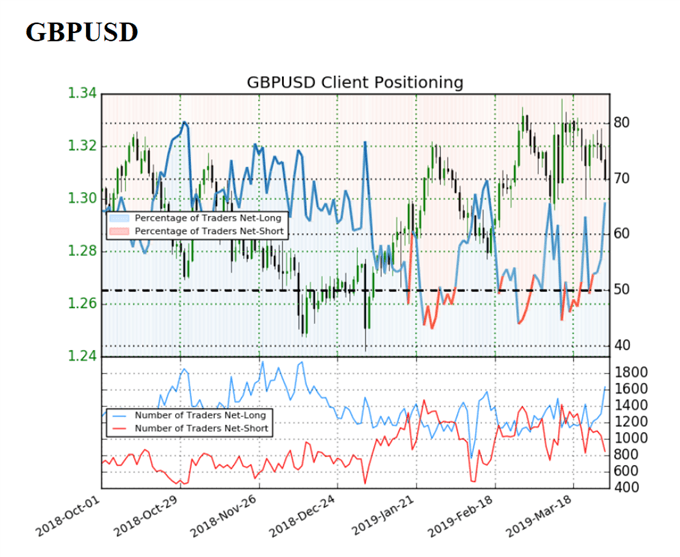
Shows 65.8% of traders are net-long GBP/USD, with the ratio of traders long to short at 1.92 to 1. The percentage of traders net-long is now its highest since March 11 when GBP/USD traded back above the 1.3100 handle. The number of traders net-long is 26.5% higher than yesterday and 17.1% higher from last week, while the number of traders net-short is 28.0% lower than yesterday and 20.9% lower from last week.
The sharp decline in net-short exposure is likely a result of profit-taking behavior as GBP/USD trades to a fresh weekly-low (1.2977) on Friday, and it seems as though the retail crowd is attempting to trade the range-bound price action carried over from late-February amid the jump in net-long interest. However, a further shift in retail interest may warn of a broader change in GBP/USD behavior, with recent developments raising the risk for a further decline in the exchange rate as both price and the Relative Strength Index (RSI) snap the bullish trends from earlier this year.
GBP/USD RATE DAILY CHART
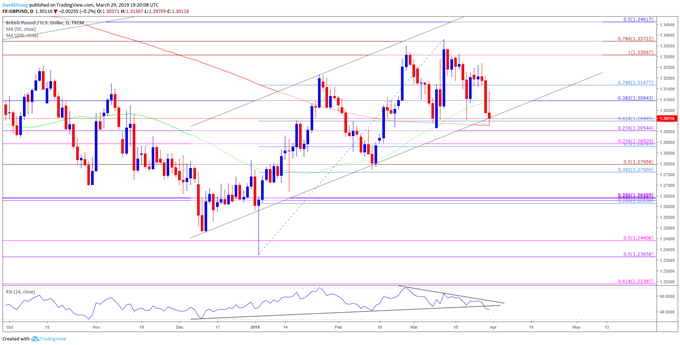
The broader outlook for GBP/USD is no longer bullish as both price and the Relative Strength Index (RSI) threaten the upwards trends from late last year, and the advance from the 2019-low (1.2373) may continue to unravel following the string of failed attempts to close above the Fibonacci overlap around 1.3310 (100% expansion) to 1.3370 (78.6% expansion).
Recent series of lower highs & lows raises the risk for a further depreciation in GBP/USD, but need a break/close below the 1.2950 (23.6% retracement) to 1.3000 (61.8% retracement) area to open up the next downside hurdle around 1.2880 (50% retracement) to 1.2890 (23.6% expansion).
The 1.2760 (38.2% retracement) to 1.2800 (50% expansion) zone comes up next followed by the overlap around 1.2610 (23.6% retracement) to 1.2640 (38.2% expansion).
BEST XM OFFER OF FREE $30 TRADING BALANCE PROFIT WITHDRAWAL
LOW SPREAD AS 0.0 PIPS


Comments
Post a Comment