Crude Oil Prices May Fall Further on Trade Wars, Oversupply Fears

CRUDE OIL & GOLD TALKING POINTS:
- Crude oil prices plunge on trade war worries, EIA inventories data
- Gold prices edge higher but key chart resistance continues to hold
- Soft US PCE data may slow liquidation, but is unlikely to offset it
Crude oil prices put in the second-largest daily drop this year yesterday. The biggest drawdown came a mere four days earlier, hinting at acceleration lower. Worries about the negative impact of trade war escalation on global growth, and thereby demand, coupled with disappointing inventory flow data appeared to be the latest catalysts. The selloff continues in APAC trade after the US threatened new tariffs targeting Mexico.
SOFT US INFLATION DATA UNLIKELY TO RESCUE BATTERED CRUDE OIL PRICES
Bellwether S&P 500 futures are pointing sharply lower, hinting at a risk-off tilt through the rest of the trading week. Soft US PCE inflation data may be something a salve for shell-shocked investors. The core rate is expected at 1.6 percent on-year in April, matching the two-year low set in the prior month. Leading survey data hints it may print lower still, boosting hopes that the Fed will dial up stimulus in the near term.
The priced-in outlook reveals that traders put the probability of a rate cut before year-end at a near-certain 90.7 percent, with the adjustment expected some time in the fourth quarter. A dovish adjustment in this view might see an upshift in this timeline. While this might leave a bit more space for a second cut before 2019 runs its course, the possibility that it materializes seems slim at best.
With that in mind, the US Dollar may hold up relatively well on a disappointing outcome, offsetting tepid selling pressure with robust haven demand as the broadly downbeat mood boosts the premium on its unrivaled liquidity. That might limit the data’s ability to offset sentiment-driven crude oil weakness. It may also make for a staid reaction from gold prices, which might have otherwise soared thanks to lower bond yields.
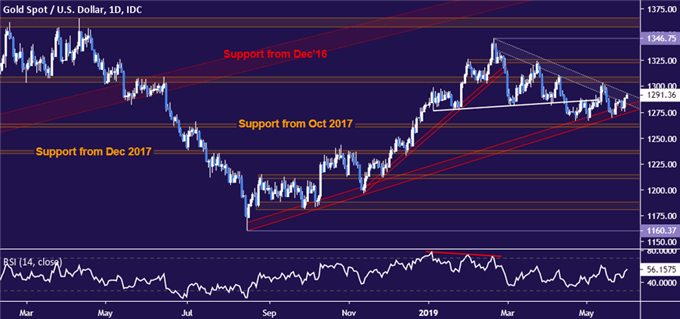
GOLD TECHNICAL ANALYSIS
Gold prices are testing resistance capping gains since late February once again. A daily close above this barrier – now at 1293.92 – exposes the 1303.70-09.12 area next. Alternatively, a reversal through rising trend line support dating back to mid-August 2018 (1274.15) targets the 1260.80-63.76 zone.
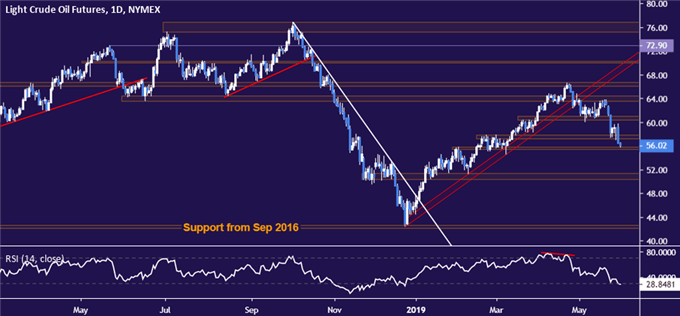
CRUDE OIL TECHNICAL ANALYSIS
Crude oil prices dropped to a three-month low, testing support in the 55.37-75 area. Breaking below that on a daily closing basis sets the stage for a test of the 50.31-51.33 zone. Alternatively, a move back above support-turned-resistance at 57.88 opens the door for another challenge of the 60.39-95 region.
COMMODITY TRADING RESOURCES
BEST XM OFFER OF FREE $30 TRADING BALANCE PROFIT WITHDRAWAL
LOW SPREAD AS 0.0 PIPS

BEST XM OFFER OF FREE $30 TRADING BALANCE PROFIT WITHDRAWAL
LOW SPREAD AS 0.0 PIPS


Comments
Post a Comment