GBP/USD Technical Analysis: Crashing to new lows – Levels to watch

- GBP/USD has dropped well below 1.2600, the lowest in three months
- The currency pair has support at 1.2530, 1.2475, and 1.2445.
- Resistance awaits at 1.2605, 1.2750, and 1.2820
GBP/USD has resumed its downfall, hitting a low of 1.2660 at the time of writing. Earlier, it advanced to 1.2628 as the US dollar lost ground as a result of falling US yields.
GBP/USD Daily Chart
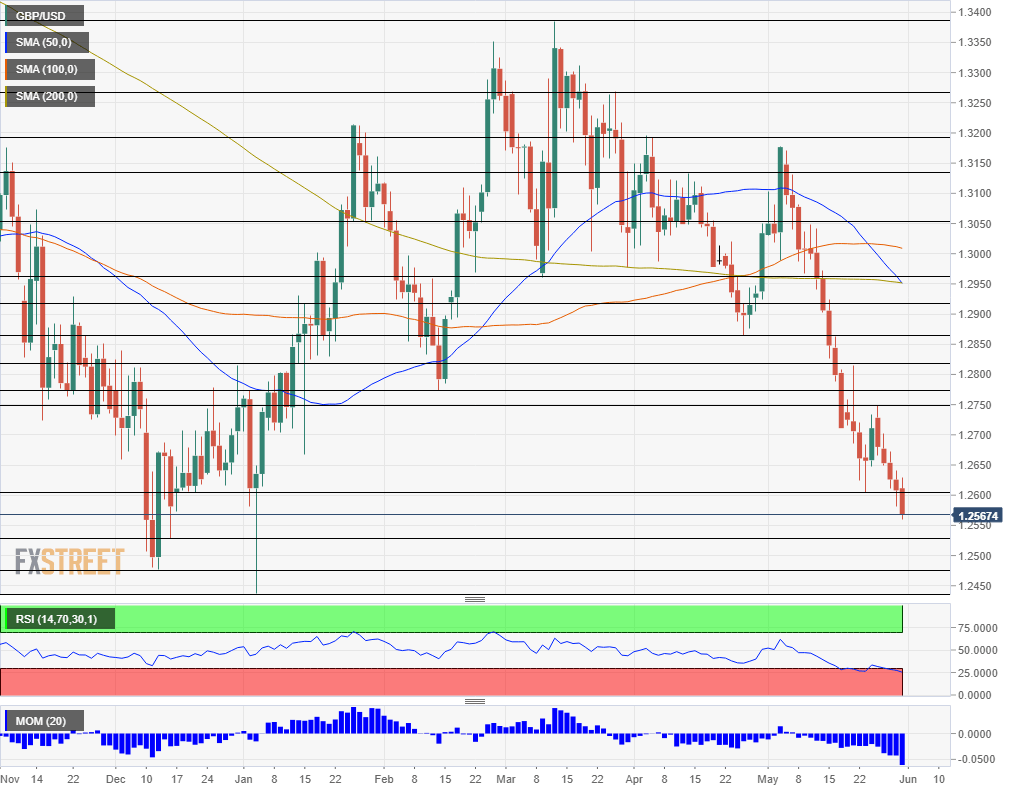
GBP/USD Support
Initial support awaits at 1.2530 which was a swing low in December 2018.
The second line to watch is 1.2475 also dates back to the same period and held the currency up for two days in a row.
The final line, for now, is 1.2445 which was the lowest point in 2019, recorded in early January. A drop below these levels will already send it to multi-year lows.
GBP/USD Resistance
The first upside level to watch is 1.2605 which was a low point last week and from where GBP/USD managed to bounce.
The next line is the weekly high of 1.2750.
1.2820 was a swing high earlier in May.
Next up
High volatility and jittery trading are likely as the week and the month draw to a close. US inflation data is eyed alongside political developments on both sides of the Atlantic.

BEST XM OFFER OF FREE $30 TRADING BALANCE PROFIT WITHDRAWAL
LOW SPREAD AS 0.0 PIPS


Comments
Post a Comment