US Dollar Technical Outlook in EUR/USD, GBP/USD, USD/CHF, USD/CAD
US DOLLAR TECHNICAL OUTLOOK:
- After a rush of excitement, digestion is back across a number of major FX pairs.
- The US Dollar ran into resistance yesterday but as yet, buyers haven’t let up as a series of short-term higher-lows has shown below recent price action.

US DOLLAR DIGESTION AFTER TRENDLINE SUPPORT
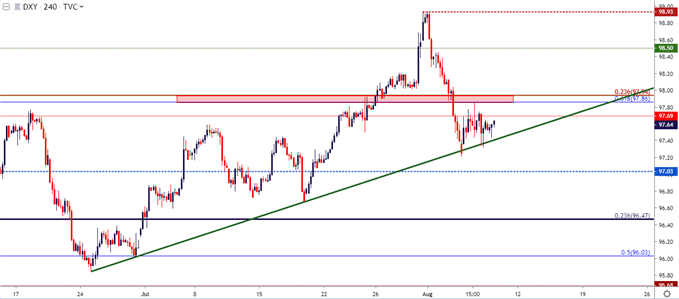
The US Dollar is continuing to show digestion following the Monday bounce. As looked at yesterday, that bounce ran up to a zone of Fibonacci levels that runs from 97.86-97.94, and that area has since helped to hold the highs. But, sellers haven’t exactly been able to take advantage of that at this point as a series of higher-lows remains under near-term price action of the US Dollar. Those higher-lows are getting an assist from a trendline produced by swing-lows in June and mid-July.
US DOLLAR FOUR-HOUR PRICE CHART
EUR/USD HOLDS AT CONFLUENT RESISTANCE ZONE
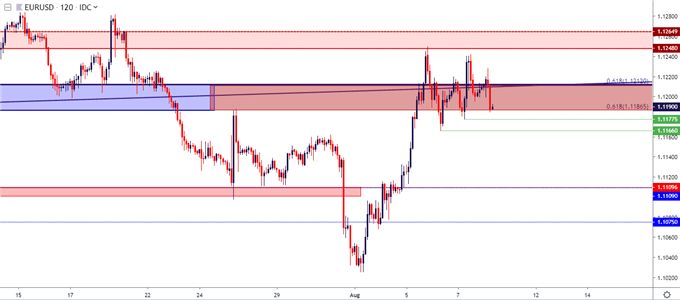
Going along with that near-term congestion in USD has been a similar theme playing out in the Euro. EUR/USD started the week by spiking up to a resistance zone around the 1.1250 level. That zone helped to moderate the advance and since then prices have been digesting within a key zone on the chart, spanning from 1.1187-1.1212. This zone has been in-play in various ways since November of last year, and this highlights a tug-of-war over the past few days.
On shorter-term variations, higher-lows within this zone can keep the door open for near-term bullish strategies.
EUR/USD TWO-HOUR PRICE CHART
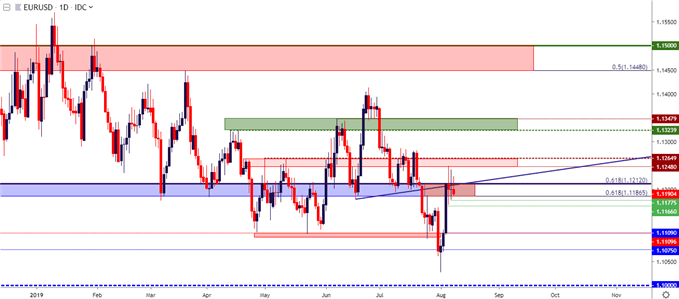
On a longer-term basis, however, a hold of this zone can keep the door open for bearish swing strategies. Given that lack of directional pull in recent USD price action, this appears to be a pick-your-poison type of operation. For those defaulting to fundamental biases, the short-side is likely more attractive as the ECB has, at the very least, talked up future loosening. The Fed at this point hasn’t opined much on the matter.

EUR/USD DAILY PRICE CHART
GBP/USD BUILDS RANGE AFTER LONG-TERM TRENDLINE
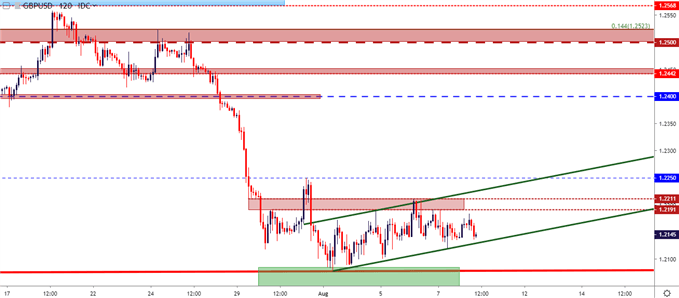
After the excitement in the British Pound through the month of July one might be surprised at the seeming lack of volatility in GBP/USD so far in August. But after a long-term trendline came into play last week, sellers haven’t been able to make much ground. Prices quickly reverted back to resistance at 1.2191-1.2211, and this has helped the pair to build in a mild range over the past five trading days. This becomes an item of interest for USD bulls, as the continued show by Cable sellers may be preluding a large break-lower should USD strength show back-up. On the two-hour chart below, a short-term bear flag formation shows after last week’s bounce at trendline support.
GBP/USD TWO-HOUR PRICE CHART
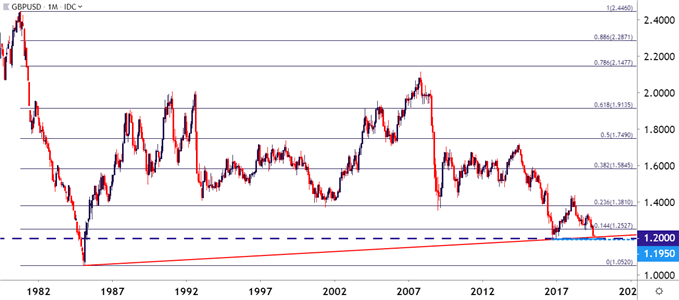
Taking a step back, and that long-term trendline comes from the pre-Plaza Accord low which connects with the flash crash lows from October of 2016. If this trend-line gives way, the next obvious level of support is the 1.2000 psychological level, after which the 1.1950 flash crash low comes in to view. But – after that? It’s a vacuum of price action and prices could drop precipitously.
GBP/USD MONTHLY PRICE CHART
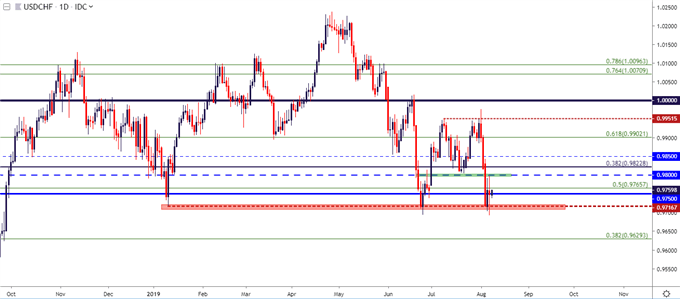
USD/CHF GRASPS ON TO 2019 LOWS
Getting away from the two more popular major pairs to look at USD/CHF, last week’s precipitous drop finally found support around the 2019 lows, taking place around the .9700 level on the chart. Yesterday saw this level get tested through but sellers couldn’t make much ground, as this was followed by an aggressive bounce right back-above the .9750 level. This can keep the door open for a deeper bounce, looking to prior support levels around .9800 or .9850 for that next level of lower-high resistance.
USD/CHF DAILY PRICE CHART
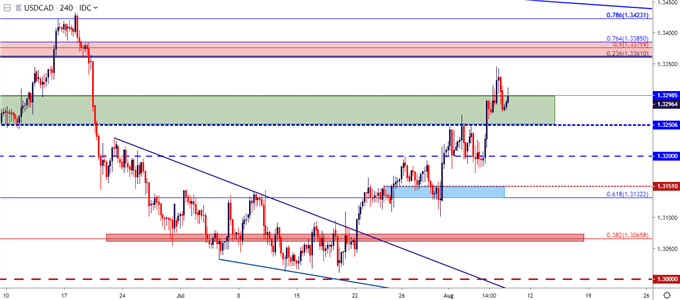
USD/CAD: Has a Top Been Set?
The bullish reversal in USD/CAD has ran pretty clean over the past few weeks. My final target on the setup was the 1.3250-1.3300 zone but, that hasn’t yet stopped the advance as buyers are showing higher-low support around this price this morning. But, we may be near a catch point given the pullback that showed yesterday, and there’s another zone of resistance sitting just ahead that could begin to help built swing setups. This runs from 1.3361-1.3385; and if this near-term theme of strength is going to extend, that becomes the next area to look to for resistance. If this bullish run doesn’t extend, looking for a break back-below 1.3250 could re-open the door for short-side scenarios in the pair.
USD/CAD FOUR-HOUR PRICE CHART

Get 5% Of your Investment daily
its so easier to start No complication, Invest For Your Future
Get $10 Free Only when Sign Up.


Comments
Post a Comment