S&P 500 Forecast: Stellar Tech Earnings Could Supercharge Risk Appetite
S&P 500 PRICE OUTLOOK:
- Earnings from Apple, Amazon, Google and Facebook collectively blew past analyst estimates
- Together, the stocks account for nearly 35% of the Nasdaq 100 and are crucial for risk appetite
- The reports could spark broader demand for US indices after looming event risk saw price action in the S&P 500 coil in anticipation
S&P 500 FORECAST: STELLAR TECH EARNINGS COULD SUPERCHARGE RISK APPETITE
Traders and investors will have a lot to digest as the weekend approaches after an incredible string of corporate reports from Apple,Amazon,Facebook and Google. Together, the stocks account for almost 35% of the Nasdaq 100 and could supercharge risk appetite in the days ahead as they have been trailblazers in the covid recovery-rally.
ELEVATED EXPECTATIONS OUTMATCHED
Across the board, each company impressed on both top and bottom lines, displaying a remarkable ability to leverage their respective platforms to profit in the unusual economic times. That said, investor expectations surrounding each of the mega-cap corporations were heightened beforehand – a theme discussed in our earnings preview. Therefore, the subsequent jump in share price for each stock is arguably more impressive than the results themselves.
Either way, big tech seems to have delivered a perfect symphony of quarterly results, forward guidance and share price reaction to curate a material improvement in market sentiment – just as the S&P 500 was displaying signs of indecisiveness. In turn, risk appetite may flourish as the FANGMAN group looks retake the reigns as the leaders in speculative interest.
A Brief History of Major Financial Bubbles, Crises and Flash-Crashes
While their impact may be observed most easily in the Nasdaq’s performance, the reports could have knock-on effects for the S&P 500 and Dow Jones, as well as other risk-sensitive assets like the Australian Dollar and crude oil, even after a concerning US GDP print. To that end, a failed follow-through for each of the stocks could complicate a broader risk-on rally which could then be considered an ominous sign in and of itself.
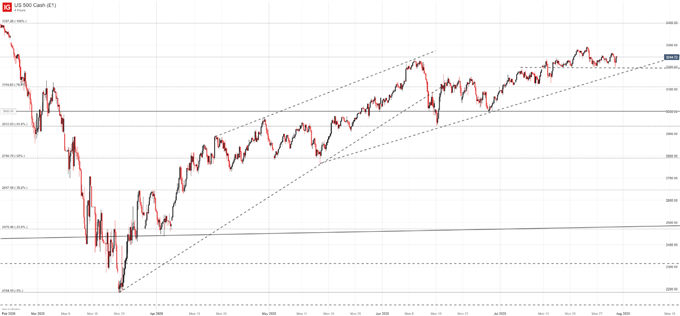
S&P 500 PRICE CHART: 4 – HOUR TIME FRAME (FEBRUARY 2020 – JULY 2020)
Nevertheless, it could be said the arrival of the major tech earnings marks the peak of the season for traders with broader macroeconomic considerations. Still, the deluge of corporate reports will continue next week as hundreds more companies are set to release results.


Comments
Post a Comment