GOLD AND SILVER PRICES PUSH HIGHER AS US REAL YIELDS TURN LOWER
GOLD (XAU/USD) AND SILVER (XAG/USD) ANALYSIS, PRICES AND CHARTS
- Gold price back above $2,000/oz as bulls return.
- Silver breaks a bearish short-term pattern.
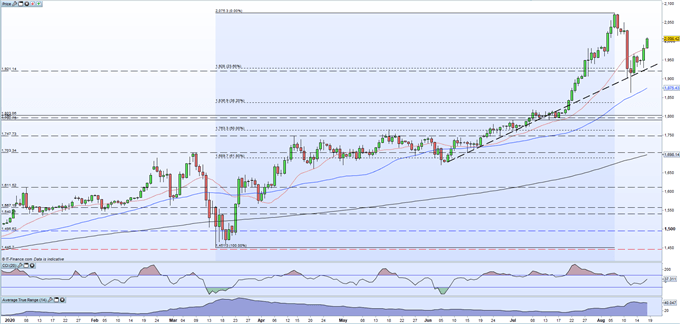
The price of gold is back above $2,000/oz. and looks set to push higher as US real yields – US nominal yields minus inflation – turn lower. Last week’s bumper US Treasury auction saw a record USD 112billion of 3-, 10- and 30-year bonds auctioned off, pushing nominal yields higher as investors sought to buy bonds at cheaper prices. With this sale now starting to become digested, US Treasury yields are starting to turn lower again, sending real yields further into negative territory. US 10-year real yields are currently -0.97%. Gold prices move higher when US real yields turn lower.
Gold continues to take its cue from the recent supportive trendline that started in early-June. The precious metal has multiple touches on this trendline, adding to its validity, and any break lower below this trend has quickly been recouped and used as a springboard to press higher. Volatility has picked up after last week’s sharp sell-off and the precious metal is not overbought yet, leaving room for further gains.
IG client sentiment warns however that gold may turn lower, with retail trade data showing 80% of traders are net-long gold, a contrarian indicator. Traders are also further net-long on a daily and weekly basis, adding further to the contrarian bearish gold sentiment. Volatility is also near a multi-month high around $40/oz. so traders need to factor this in before committing to the market. To the upside the $2,018 - $2,030/oz. area should provide resistance before $2,075/oz. looms back into view.
GOLD DAILY PRICE CHART (JANUARY – AUGUST 18, 2020)
SILVER CONTINUES TO MAKE SHORT-TERM HIGHER LOWS
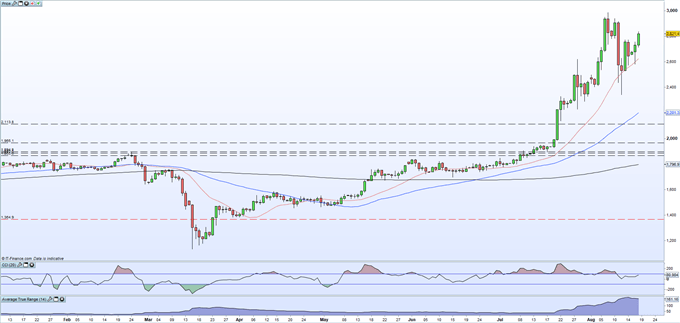
Silver is currently trading over 3% higher on the session at $28.18 and has made its fifth higher low in a row since slumping to a $23.44 low print last Wednesday. The 20-day moving average remains supportive with silver not opening below this indicator since mid-June. As with gold, volatility – using ATR – should be monitored as the current level is nearly four times higher than price action seen between mid-May and mid-July. If the 20-dma remains supportive then $26.26 should provide initial support while $29.20 and $29.42 provide prior high resistance ahead of $29.90.
SILVER DAILY PRICE CHART (JANUARY – AUGUST 18, 2020)
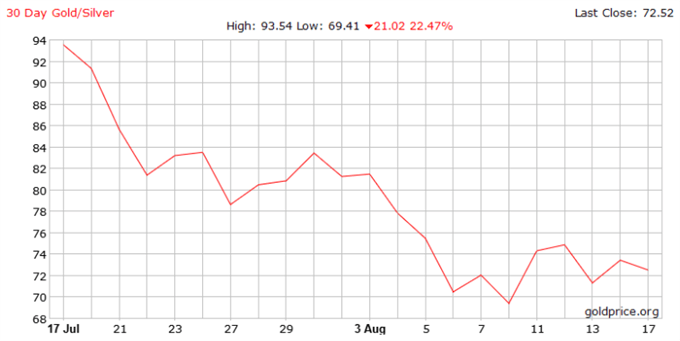
Silver continues to out-perform gold in the short-term with silver up around 37% over the last month compared to gold’s 9%+ performance. This has forced the gold/silver ratio sharply lower from around 94 to 72 over the last 30-days.


Comments
Post a Comment