GOLD PRICE LEVELS TO WATCH AS REBOUND FROM AUGUST LOW UNRAVELS
GOLD PRICE TALKING POINTS
The price of gold has faced a sharp pullback after hitting a fresh record high ($2075) in August, and the precious metal may continue to search for support over the coming days as the rebound from the monthly low ($1863) unravels.
GOLD PRICE LEVELS TO WATCH AS REBOUND FROM AUGUST LOW UNRAVELS
The price of gold fails to extend the series of higher highs and lows from the previous week as the bullish momentum abates, and looming developments in the Relative Strength Index (RSI) may indicate a potential shift in market behavior as the oscillator falls back from overbought territory and slips to its lowest level since June.
It remains to be seen if the RSI will approach oversold territory after pushing above 70 on three separate occasions earlier this year, and macroeconomic backdrop may keep the price of gold afloat as it trades to fresh yearly highs during every single month so far in 2020.
In turn, the price of gold may test former resistance zones for support as the Federal Reserve shows little intentions of altering the course for monetary policy, and the central bank may continue to endorse a dovish forward guidance as Fed officials vow to “increase our holdings of Treasury and agency mortgage-backed securities at least at the current pace.”
As a result, the Federal Open Market Committee (FOMC) Minutes may heighten the appeal of bullion as Chairman Jerome Powell and Co. remain “committed to using our full range of tools to support the economy,” and the low interest rate environment along with the ballooning central bank balance sheets may continue to act as a backstop for the price of gold as market participants look for an alternative to fiat-currencies.
At the same time, it appears as though the crowding behavior in the US Dollar will persist over the coming days as the IG Client Sentiment report continues to show retail traders net-long USD/CHF, USD/CAD and USD/JPY, while the crowd remains net-short AUD/USD, GBP/USD, EUR/USD and NZD/USD.
The net-long US Dollar bias has carried over from July even though the DXY index has plummeted more than 8% off the April highs, and the depreciation in the Greenback may keep the price of gold afloat as the FOMC appear to be on track to retain the current policy throughout the remainder of the year.
GOLD PRICE DAILY CHART
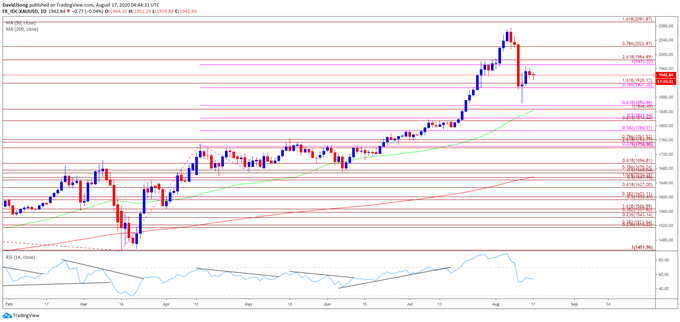
Source: Trading View
- The technical outlook for the price of gold remains constructive as it trades to fresh yearly highs during every single month so far in 2020, with the bullish behavior also taking shape in August as precious metal tags a new 2020 high ($2075).
- The price of gold cleared the previous record high recorded in September 2011 ($1921) even though the Relative Strength Index (RSI) failed to retain the upward from June, but the indicator registered a new extreme reading (88) for 2020 as the oscillator pushed into overbought territory for the third time this year.
- In turn, the move below 70 in the RSI could be indicative of a potential exhaustion in the bullish behavior rather than a change in trend, but a break below 30 may signal a shift in market dynamics as it would mark the first oversold reading since 2018.
- Until then, the price of gold may continue to search for support as the rebound from the monthly low ($1863) unravels ahead of the Fibonacci overlap around $1971 (100% expansion) to $1985 (261.8% expansion), with lack of momentum to hold above the $1907 (100% expansion) to $1920 (161.8% expansion) region bringing the $1847 (100% expansion) to $1857 (61.8% expansion) area back on the radar, which largely lines up with the 50-Day SMA ($1844).
- Next area of interest comes in around $1814 (61.8% expansion) to $1822 (50% expansion), which acted as resistance throughout the first-half of July, followed by the $1786 (38.2% expansion) region.


Comments
Post a Comment