DOW JONES REBOUNDS AT 23.6% FIBONACCI LEVEL, NIKKEI 225, ASX 200 CLIMB


DOW JONES, NIKKEI 225, ASX 200 INDEX OUTLOOK:
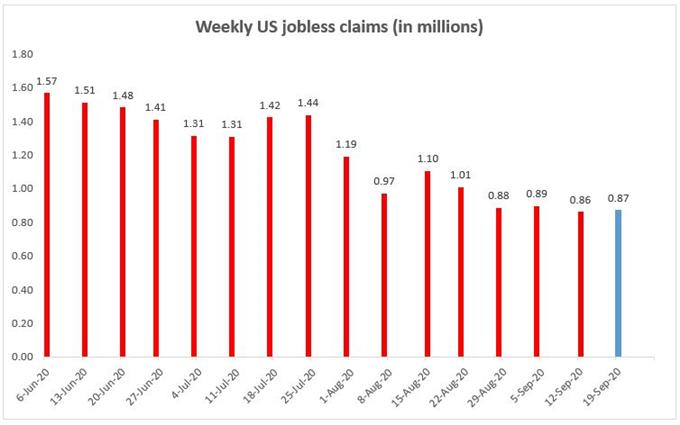
- Dow Jones Industrial Average (Dow) rebounded from 22,600– the 23.6% Fibonacci retracement
- Nikkei 225 and ASX 200 index opened higher, albeit near-term momentum remains weak
- The US Dollar retraced from a two-month high, alleviating pressure over commodity prices
DOW JONES INDEX OUTLOOK:
Dow Jones Industrial Average index (Dow) futures climbed during early Asia hours after registering a small gain on Thursday. The US weekly jobless claim number came in at 870k, in line with expectations. This marked a fourth consecutive weekly reading below 1 million mark, but the rate of improvement in the jobs market appears to have slowed recently. Next Friday’s non-farm payroll reading will be closely monitored by market participants for more clues.
Asia-Pacific markets may enjoy a relief rebound on Friday, following positive leads from the US session. Traders face a relatively quiet calendar day, with the US durable goods order among top market events. Read more on our economic calendar website.
The US Dollar Index (DXY) has retraced to 94.38 from 94.65 this morning, alleviating pressure over precious metal and crude oil prices. The VIX volatility index has fallen back to around 32.4 as stocks rebounded. This, however, seems to be a temporary relief as concerns remain on a stalling US fiscal stimulus package, and climbing coronavirus cases in Europe.
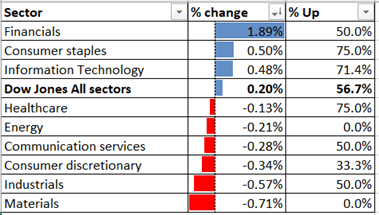
Overnight trading displayed a fairly balancedsectoral pattern, with financials (+1.89%), consumer staples (+0.5%) and information technology (+0.48%) outperforming, whereas materials (-0.71%), industrials (-0.57%) and consumer discretionary (-0.34%) lagging.
Dow Jones Index Sector performance 24-9-2020
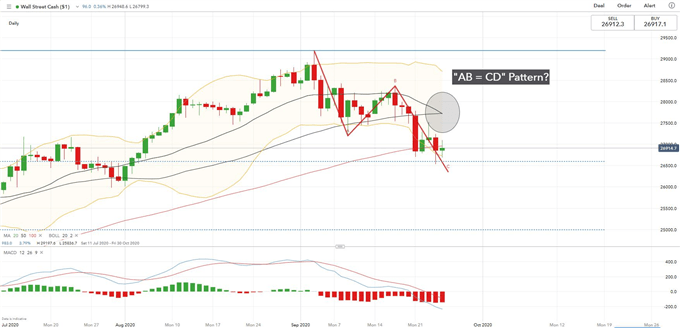
Technically,the Dow has rebounded from the 23.6% Fibonacci retracement level at 26,600, which may serve as an immediate support. The 20-Day Simple Moving Average (SMA) line is about to cross below the 50-Day SMA, potentially forming a “Death Cross”. The MACD momentum indicator remains in bearish setup, which suggests that there might be more consolidation ahead. A bullish “AB=CD” pattern is emerging in the daily chart.
Dow Jones Index – Daily Chart
NIKKEI 225 INDEX OUTLOOK:
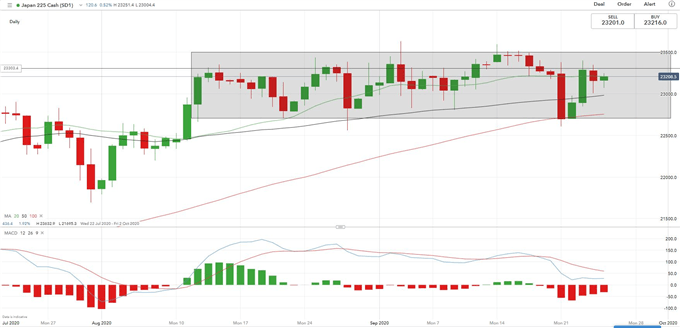
Japan’s Nikkei 225 index was ranging between 22,700 to 23,500 for the past few weeks, with a weaker Japanese Yen helping to cushion external headwinds. Immediate support levels could be found at 50-Day and 100-Day SMA lines, at 22,980 and 22,750 respectively.
Nikkei 225 Index – Daily Chart
ASX 200 INDEX OUTLOOK:
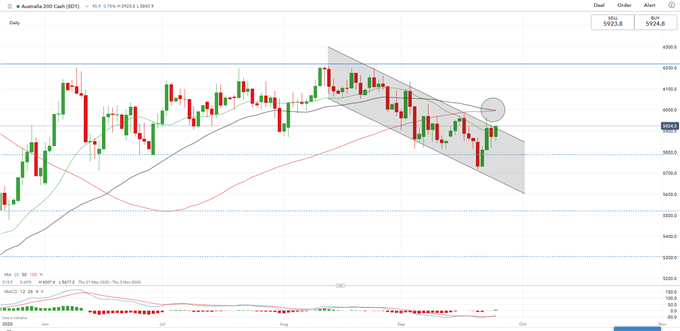
Australia’s ASX 200 index opened 0.8% higher, attempting to challenge the upper ceiling of the “Descending Channel”. The short-term trend of the ASX 200 index appears biased towards the downside, as its 50-Day DMA has likely crossed below the 100-Day, potentially forming a bearish crossover. An immediate support level can be found at 5,780 – the 23.6% Fibonacci retracement.
ASX 200 Index – Daily Chart


Comments
Post a Comment