Gold Prices Flirt with Breakdown, ISM Data Due But FOMC in Focus
GOLD & CRUDE OIL TALKING POINTS:
- Gold prices back on the defensive as FOMC meeting nears
- Crude oil prices pop on bets Iran nuclear deal may unravel
- Manufacturing ISM survey, API inventory data due ahead
Gold prices turned lower anew as speculation about a steepening Fed interest rate hike cycle ahead of the upcoming FOMC policy announcement put the US Dollar back on the offensive. That undercut the appeal of non-interest-bearing and anti-fiat assets and made a familiar impression on the yellow metal, pushing it down to touch the lowest level in over a month.
Crude oil prices briefly shot higher after Israeli Prime Minister Binyamin Netanyahu said his country had passed intelligence to the US indicating Iran was secretly developing nuclear weapons in violation of its agreement with the US and a roundup of world powers. Mr Netanyahu’s comments were probably interpreted as signaling that stiff sanctions might be re-imposed, pulling Iranian crude off the market once again.
MANUFACTURING ISM, API INVENTORIES DATA IN FOCUS
Looking ahead, April’s manufacturing ISM survey headlines the economic data docket. It is expected to show that factory-sector activity growth slowed for a second month having set a two-year high in February. US news-flow has firmed relative to forecasts recently, opening the door for an upside surprise. Upbeat cues in analogous Markit Economics PMI statistics bolster the possibility of such an outcome.
A strong showing may stoke bets on a steeper Fed rate hike cycle, adding to the greenback’s gains and punishing gold prices. Crude oil may likewise suffer, brought lower by de-facto selling pressure because prices are denominated in USD terms on global markets. API inventory flow data may cloud transmission however. It will be judged against forecasts calling for a 916.7k build to be reported in official EIA statistics.
GOLD TECHNICAL ANALYSIS
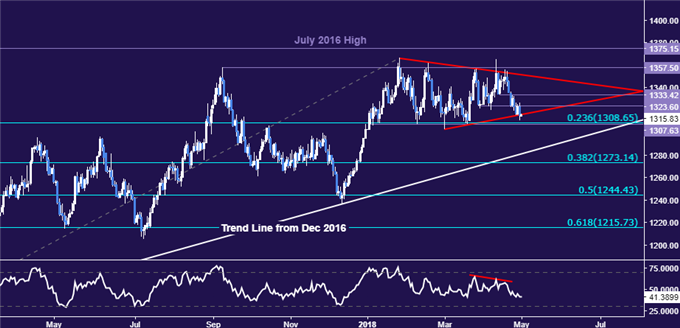
Gold prices are hanging by a thread at Triangle chart pattern support. A break below it and the 1307.63-08.65 area (range floor, 23.6% Fibonacci expansion) exposes the 1273.14-81.35 zone (38.2% level, trend lien from December 2016). Alternatively, a turn back above support-turned-resistance at 1323.60 opens the door to retest 1333.42.

CRUDE OIL TECHNICAL ANALYSIS
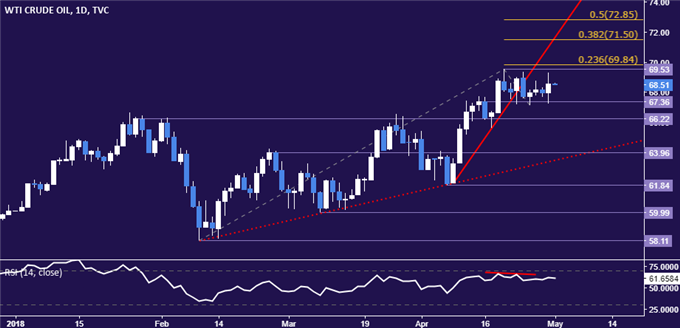
Crude oil prices remain stuck in a familiar range below the $70/bbl figure. A break of the range floor at 67.36 exposes resistance-turned-support at 66.22. Alternatively, push beyond the 69.53-84 area (April 19 high, 23.6% Fib expansion) targets the 38.2% level at 71.50.

IF YOU WOULD LIKE TO RECEIVE OUR SIGNALS THROUGH TELEGRAM
JUST JOIN US AND SEARCH FOREX SIGNALS 99.9 AND CLICK OUR LOGO
Start Trading with Free $30 : CLAIM NOW $30
VERIFY YOUR ACCOUNT AND GET YOUR $30 INSTANTLY ,MAKE MONEY WITHDRAW !!
IT IS POSSIBLE TO SHIFT FROM $30 TO $1,000,000 TRY TODAY


Comments
Post a Comment