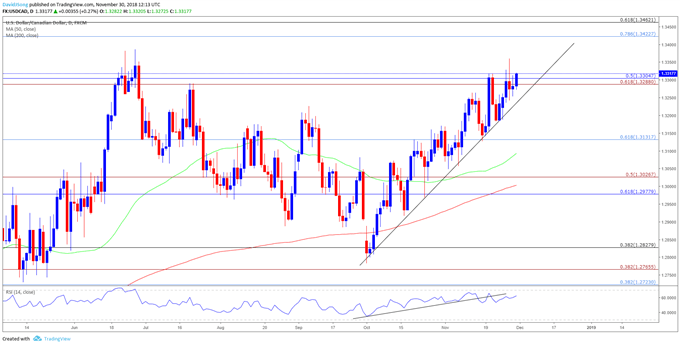
USD/CAD Rate to Eye 2018-High on Lackluster Canada GDP Report
TRADING THE NEWS: CANADA GROSS DOMESTIC PRODUCT (GDP)
Updates to Canada’s Gross Domestic Product (GDP) report may fuel the recent appreciation in USD/CAD as the economy is expected to grow 2.0% in the third-quarter of 2018 compared to the 2.9% expansion during the previous period.

Signs of easing activity may produce headwinds for the Canadian dollar as it encourages the Bank of Canada (BoC) to keep the benchmark interest rate on hold at the next meeting on December 5, and Governor Stephen Poloz & Co. may endorse a wait-and-see approach ahead of 2019 as the ‘Governing Council will continue to take into account how the economy is adjusting to higher interest rates, given the elevated level of household debt.’
In turn, a marked slowdown in Canada’s growth rate may push USD/CAD closer to the 2018-high (1.3386), but an above-forecast GDP may curb the near-term advance in the dollar-loonie exchange rate as it puts pressure on the BoC to further normalize monetary policy over the coming months.
IMPACT THAT CANADA GDP REPORT HAS HAD ON USD/CAD DURING THE PREVIOUS QUARTER
Period
|
Data Released
|
Estimate
|
Actual
|
Pips Change
(1 Hour post event )
|
Pips Change
(End of Day post event)
|
2Q
2018
|
08/30/2018 12:30:00 GMT
|
3.1%
|
2.9%
|
-5
|
-18
|
2Q 2018 Canada Gross Domestic Product (GDP)
USD/CAD15-Minute Chart

Canada grew 2.9% per annum in the second-quarter after expanding a revised 1.4% during the first-three months of 2018, with a deeper look at the report showing the growth rate holding flat in June versus expectations for a 0.1% rise. The below-forecast GDP may encourage the Bank of Canada (BoC) to keep the benchmark interest rate on hold in September after delivering a 25bp rate-hike in July, but the central bank may continue to prepare Canadian households and businesses for higher borrowing-costs as the ‘Governing Council expects that higher interest rates will be warranted to keep inflation near target.’
The initial uptick in USD/CAD was short-lived, with the exchange rate pulling back ahead of the 1.3150 region to close the day at 1.3110.
USD/CAD DAILY CHART

- USD/CAD appears to be on its way to test the 2018-high (1.3386) as it continues to track the upward trend carried over from the previous month, but theRelative Strength Index (RSI) offers a mixed signal as the oscillator appears to be deviating from price.
- Need a close above the Fibonacci overlap around 1.3290 (61.8% expansion) to 1.3310 (50% retracement) to open up the next topside hurdle around 1.3420 (78.6% retracement) to 1.3460 (61.8% retracement).
- However, string of failed attempt to close above the 1.3290 (61.8% expansion) to 1.3310 (50% retracement) region may bring the downside targets back on the radar, with the first region of interest coming in around 1.3130 (61.8% retracement) followed by the overlap around 1.3290 (61.8% expansion) to 1.3310 (50% retracement).
________________________________________________________________________
______________________________________________________________


Comments
Post a Comment