Australian Dollar, S&P 500 Gain on Upbeat China PMI. Resistance Next?
AUSTRALIAN DOLLAR, AUD/USD, S&P 500, CHINA PMI - TALKING POINTS
- Australian Dollar, S&P 500 futures gain on upbeat China PMI data
- Recovery from world’s largest economy bodes well for global growth
- AUD/USD may be restrained by descending resistance as it ranges
The pro-risk Australian Dollar received a cautious boost, alongside S&P 500 futures, as a group of official Chinese PMI data crossed the wires. Manufacturing PMI clocked in at 50.9, slightly higher than the 50.5 estimate. The non-manufacturing statistic printed at 54.4, again higher than the 53.6 consensus. With PMI readings, values above 50 indicate growth in the reported sector and vice versa.
With the Reserve Bank of Australia unlikely to act on adjusting interest rates amid heightened coronavirus cases in the US and locally, the importance of the data for AUD/USD likely has more to do with its broader implications for global growth. China is also of course Australia’s largest trading partner and economic activity in the former often implies knock-on effects for the latter.
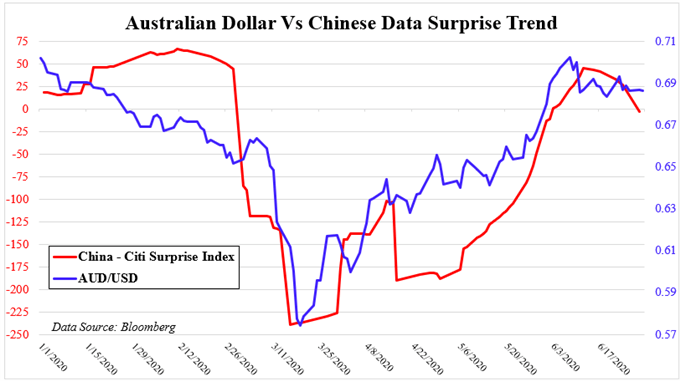
On the chart below is the Citigroup economic surprise index tracking China overlaid with the Australian Dollar. The former measures data outcomes relative to economists’ expectations. Values increasingly above 0 indicate outcomes tending to surprise above estimates and vice versa. Since the Aussie bottomed in March, it rallied in tandem with the swift recovery from the world’s largest economy.
Since the beginning of this month however, China seems to be struggling to find further momentum in rosy data surprises. Today’s readings could help reinvigorate that trend, potentially boding well for the Australian Dollar. Downside risks remain though. The United States has seen cases reach daily record levels of late. The state of Arizona just closed bars, gyms and movie theaters for 30 days. More of the same could sink growth.
AUD/USD VERSUS AGGREGATE CHINA DATA PERFORMANCE

Chart Created in TradingView
AUSTRALIAN DOLLAR TECHNICAL ANALYSIS
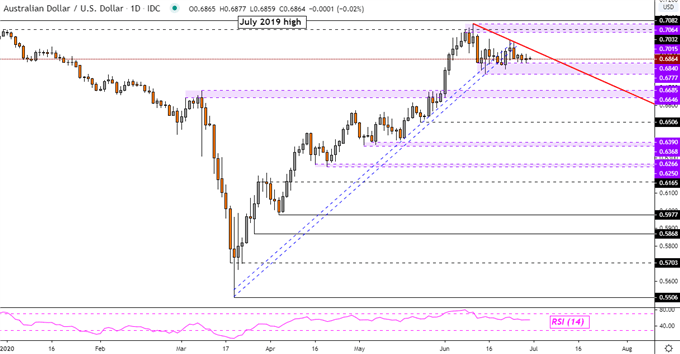
From a technical standpoint, the Australian Dollar remains in a congestive setting since AUD/USD topped at the beginning of June. Key support sits immediately below at 0.6777 – 0.6840. There might be descending resistance forming from the June 10 high – red line on the daily chart below.
This trend line could risk accelerating AUD/USD’s top given confirmation of a breakout below support. That would expose the 0.6685 – 0.6646 inflection range. Otherwise, uptrend resumption entails taking out 0.7015 – 0.7064 which would open the door to testing the July 2019 high.
| CHANGE IN | LONGS | SHORTS | OI |
| DAILY | -1% | 6% | 3% |
| WEEKLY | 29% | -6% | 6% |
AUD/USD DAILY CHART


Comments
Post a Comment