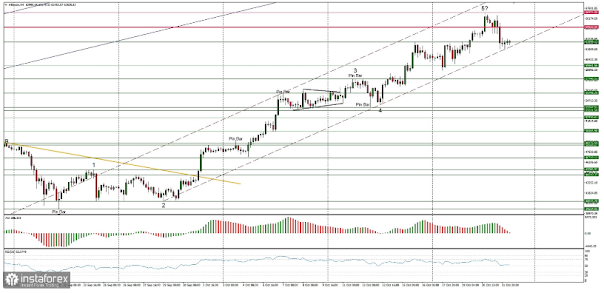
Technical Analysis of BTC/USD for October 22, 2021
Crypto Industry News:
Bitcoin surpassed its record high after the launch of the ProShares Bitcoin Strategy, BITO exchange-traded fund (ETF) on Tuesday. However, market analysts believe that the key cause of the price jump is investors' fear of inflation.
The launch of BITO, which brought the highest ever natural volume on day one for an ETF, "is unlikely to trigger a new phase of much more fresh capital going into Bitcoin," JPMorgan said.
JPMorgan believes that as gold has failed to respond to concerns over rising cost pressures in the past few weeks, Bitcoin's renewed role as a better hedge against inflation is a major reason for the current boom. The team stressed that the move away from ETFs to Bitcoin funds has been gaining momentum since September.
As the first ETF related to Bitcoin futures in the United States, the Bitcoin Strategy ETF ProShares began trading on the New York Stock Exchange on Tuesday at an opening price of $ 40 per share. This allows investors to have direct exposure to cryptocurrency futures on a regulated market.
Technical Market Outlook:
The BTC/USD pair has made a new ATH located at the level of $66,974 before the local low was made at $61,838. Currently the market is consolidating the recent gains. The next technical support is seen at the level of $59,561, but the corrective cycle might extend even towards the key short-term technical support located at $53,331 if the corrective wave of higher degree starts. Please keep an eye on this level as any violation of this level will be negative for bulls. However, so far, the up trend is intact and the target level for the current up wave is located around $74,000.
Weekly Pivot Points:
WR3 - $72,401
WR2 - $67,700
WR1 - $63,611
Weekly Pivot - $58,705
WS1 - $54,810
WS2 - $49,233
WS3 - $45,621
Trading Outlook:
According to the long-term charts the bulls are still in control of the Bitcoin market, so the up trend continues and the next long term target for Bitcoin is seen at the level of $70,000. The next mid-term target is seen at the level of $64,920 (the previous AT level). This scenario is valid as long as the level of $30,000 is clearly broken on the daily time frame chart (daily candle close below $30k).
=> Copy Our Trades
=> Free Account Management.


Comments
Post a Comment